Monday, 26 September 2011

chemfp 1.0 - Get your fingerprints off this

Andrew Dalke has just released V1.0 of his chemical fingerprint package, chemfp. The goal of the project is to produce a standardised file format called FPS for chemical fingerprints, as well as a set of tools around them. The project itself is a Python module with some superfast C code.

Why is this needed? Well, right now, if you wanted to use several different toolkits to generate fingerprints and then compare and contrast their use for some application (e.g. 2D similarity searching), you would have to go to quite some lengths to figure out how to handle the file format from each toolkit, and so forth. You could of course avoid the file format completely and use a standard API such as Cinfony, but it's often useful to precalculate the fingerprint and store as a file (also, you may not have access to the toolkit, only a file of fingerprints).

So, if you have the appropriate toolkit, you can use chemfp to generate fingerprints in the FPS format. For example, if you have the Python bindings for Open Babel, you can use generate the FP2, FP3, FP4 and MACCS fingerprints in FPS format. Other toolkits are supported, namely OEChem and RDKit, with their own fingerprints. Of course, it would make sense for this format to be supported by the toolkits themselves, and indeed Cactvs already supports the FPS format, as does Rajarshi's fingerprint R package. Direct FPS support by Open Babel is also on the cards.

What about the tools around this format? Right now, there's only a similarity search tool, but that already is very useful as (for example) it supports "many against many" searches, a feature which I have heard requested by several Open Babel users. More tools are on the way though. It's also possible to write your own tools using the Python API. For example, Andrew has written up examples on generating a distance matrix and drawing a cluster dendrogram (in about 20 lines of code, albeit with the help of a few libraries), and on Taylor-Butina clustering (this one maybe 40 lines).

So check it out at http://chem-fingerprints.googlecode.com. In particular, the documentation is excellent.

Image credit: Jack of Spades

Tuesday, 13 September 2011

Comments on 5th Meeting on U.S. Government Chemical Databases and Open Chemistry

As previously discussed, I attended and presented at the 5th Meeting on U.S. Government Chemical Databases and Open Chemistry in Frederick, Maryland. Talks were 20 min plus 5 for questions and so quite a lot of ground was covered over the two days.

I understand that Marc is going to put up many of the talks on the web somewhere (insert link here from future), but in the meanwhile you can check out several of the talks over at Lanyrd. The image above is from John Overington's talk (included with permission), and is meant as a joke as in reality the various databases really do cooperate quite well. In fact there was some talk (-ing) of just having a single database maintained by several partners (like the PDB does it).

Now some random notes on the meeting...

It's interesting to note that many of the ideas championed by PMR have now mainstreamed. As an example, the database people were very clear that chemical data should be available directly from publications (in this day and age) rather than have to manually (or automatically) read the literature and enter it in as ChEMBL (and many others) are doing. Attendees on various editorial boards were planning to try to make this happen, although it was noted that submissions to non-prestige journals decrease with every additional hurdle for authors. The counter argument was made that providing these data would make the publication more discoverable, something academia is very keen on.

Jonathan Goodman took a break from finding InChIKey collisions to describe some work on the development of RInChI, a variant on InChI for reaction indexing.

Jasmine Young from the PDB pointed out that reviewers have a role in ensuring data quality too; the PDB is an archival site, not a policing site, and journal reviewers should request the validation report from the PDB when reviewing papers with protein crystal structures.

I learnt, at least a bit, about computational toxicology programmes. Ann Richard from the National Center for Computational Toxicology (part of the EPA) described Tox21 and ToxCast, two large screening programmes. Tox21 has 10,000 chemicals with 50->100 assays, while ToxCast has 960 chemical and 500 assays (E&OE). The overall idea is to generate high quality tox data that can be used to develop tox models and essentially push the whole field forward. QC review of the chemicals bought from suppliers was an important and essential part of the process; 20->30% of purchased chemicals had "issues" (purity but also identity).

Nina Jeliazkova described the EU OpenTox programme (see slides at link above). Apparently, this programme is just complete but it has successfully developed a set of resources, principally a REST interface to a series of webservices for QSAR. Essentially, these webservices can be used to build a model and make predictions. Applications can be built using these webservices, e.g. ToxPredict and ToxCreate.

On the way back from the meeting, I decided to stop off in Keflavik airport in Iceland due to smoke in the cockpit. Any recommendations for must-have Icelandish merch for next time? I held back from buying a jar of volcanic ash from Eyjafjallajökull, and went for the liquorice instead.

Monday, 29 August 2011

Presentation on Open Babel and Databases at 5th Meeting on U.S. Government Chemical Databases and Open Chemistry

I was fortunate to be able to attend and present at last week's 5th Meeting on U.S. Government Chemical Databases and Open Chemistry in Frederick, Maryland. This was really an excellent meeting, and I have to thank Marc Nicklaus for the invitation and support to attend, and especial thanks to Julia Lam for the superb organisation.

I'll blog separately about the meeting itself, but first here's my talk, "Improving the quality of chemical databases with community-developed tools (and vice versa)", which discussed improvements in Open Babel over the last 2 years in the handling of chemical data, and using Open Babel to find errors in databases:
View more presentations from baoilleach
In case it's not obvious, the work presented in the first half involved all of the Open Babel developers, each working on different aspects of the toolkit.

Wednesday, 3 August 2011

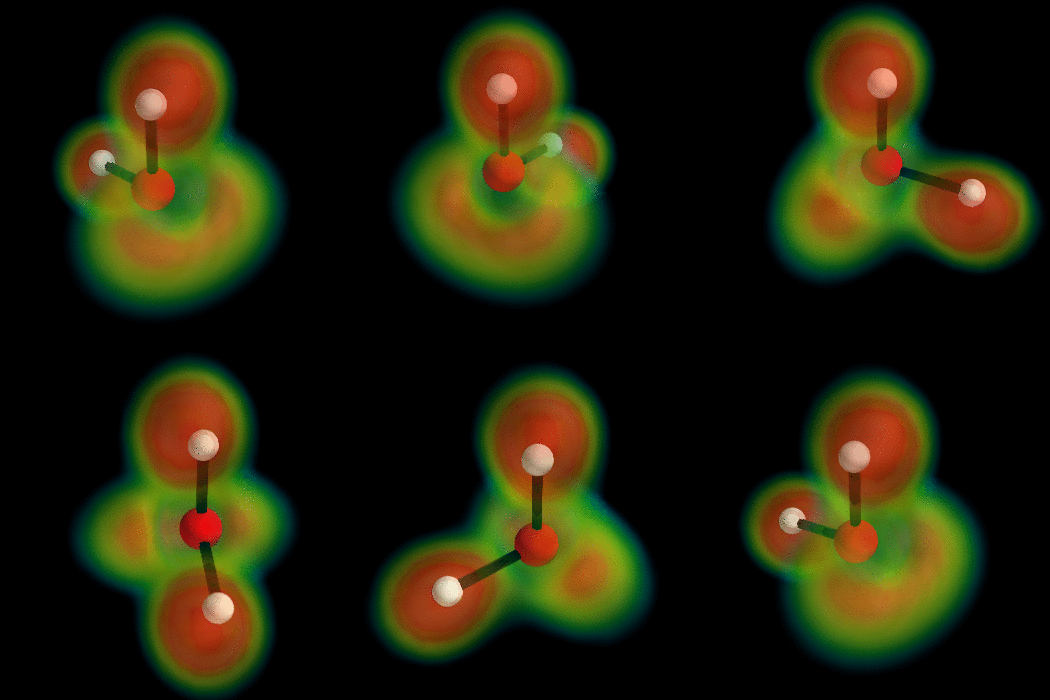
The electron density is not an isosurface

There's no need for us to keep drawing isosurfaces for the electron density and other volumetric data generated by QM calculations. Driven by the engineering field, there are a couple of really amazing open source visualisation toolkits out there that we can use to do so much more. One of these is the VTK.

David Lonie, as part of Google Summer of Code with Marcus Hanwell of VTK/Avogadro as mentor, is integrating aspects of the VTK into Avogadro (see this post for example). But I can't wait, so I've busted out the VTK myself and now present the ELF of water:

To generate this type of image, install Mayavi2 (not exactly trivial to be honest), and then run the following Python script to generate PNG files (this script is adapted from a Mayavi example, which you may want to run first):
"""
In this example, we display the H2O molecule, and use volume rendering to
display the electron localization function.

The atoms and the bounds are displayed using mlab.points3d and
mlab.plot3d, with scalar information to control the color.

The electron localization function is displayed using volume rendering.
Good use of the `vmin` and `vmax` argument to
`mlab.pipeline.volume` is critical to achieve a good visualization: the
`vmin` threshold should placed high-enough for features to stand out.

The original is an electron localization function from Axel Kohlmeyer.
"""
# Author: Gael Varoquaux <gael.varoquaux@normalesup.org>
# Copyright (c) 2008, Enthought, Inc.
# License: BSD Style.
# Edited by: Noel O'Boyle <baoileach@gmail.com>

# Retrieve the electron localization data for H2O ##############################
import os
if not os.path.exists('h2o-elf.cube'):
    # Download the data
    import urllib
    print 'Downloading data, please wait'
    opener = urllib.urlopen(
        'http://code.enthought.com/projects/mayavi/data/h2o-elf.cube'
        )
    open('h2o-elf.cube', 'wb').write(opener.read())


# Plot the atoms and the bonds #################################################
import numpy as np
from mayavi import mlab
mlab.options.offscreen = True
mlab.figure(1, bgcolor=(0, 0, 0), size=(350, 350))
mlab.clf()

# The position of the atoms
atoms_x = np.array([2.9, 2.9, 3.8])*40/5.5
atoms_y = np.array([3.0, 3.0, 3.0])*40/5.5
atoms_z = np.array([3.8, 2.9, 2.7])*40/5.5

O = mlab.points3d(atoms_x[1:-1], atoms_y[1:-1], atoms_z[1:-1],
                  scale_factor=3,
                  resolution=20,
                  color=(1, 0, 0),
                  scale_mode='none')

H1 = mlab.points3d(atoms_x[:1], atoms_y[:1], atoms_z[:1],
                   scale_factor=2,
                   resolution=20,
                   color=(1, 1, 1),
                   scale_mode='none')

H2 = mlab.points3d(atoms_x[-1:], atoms_y[-1:], atoms_z[-1:],
                   scale_factor=2,
                   resolution=20,
                   color=(1, 1, 1),
                   scale_mode='none')

# The bounds between the atoms, we use the scalar information to give
# color
mlab.plot3d(atoms_x, atoms_y, atoms_z, [1, 2, 1],
            tube_radius=0.4, colormap='Reds')

# Display the electron localization function ###################################

## Load the data, we need to remove the first 8 lines and the '\n'
str = ' '.join(file('h2o-elf.cube').readlines()[9:])
data = np.fromstring(str, sep=' ')
data.shape = (40, 40, 40)

source = mlab.pipeline.scalar_field(data)
min = data.min()
max = data.max()
vol = mlab.pipeline.volume(source, vmin=min+0.65*(max-min),
                                   vmax=min+0.9*(max-min))

mlab.view(132, 54, 45, [21, 20, 21.5])

##mlab.show()

f = mlab.gcf()
for i in range(36):
    f.scene.camera.azimuth(10)
    f.scene.render()
    mlab.savefig('example_%02d.png' % i)

To create an AVI from these PNGs, use mencoder:
C:\Tools\mayavi>..\MPlayer-p4-svn-33883\mencoder.exe "mf://example_%02d.png" -mf fps=10 -o anim.avi -ovc lavc -lavcopts vcodec=msmpeg4v2:vbitrate=500

To create an animated GIF use ImageMagick:
C:\Tools\mayavi>convert -delay 10 -loop 0 example_*.png animation.gif

Sunday, 24 July 2011

Depict a chemical structure...without graphics Part II

In an earlier post, I showed how PNGs depicting 2D molecular structures could be viewed in a text terminal. This can be useful when you're logged into a remote server and don't have access to a graphical viewer.

Just for fun, I've thrown together an ASCII depiction format for Open Babel that uses aalib. But this time, rather than create a PNG depiction and then convert that to ASCII, this "Painter" (in the language of the Open Babel API) draws the structure directly onto an ASCII canvas. This should lead to better resolution, although I haven't done a proper head-to-head comparison. Here's how it looks in action (compare to the images in my earlier post):
Note that I haven't checked this code into SVN, and I'm not sure I will. For my own reference, I've stored some of the relevant files at this link (diff against r4530). Includes code taken from aa-helper.

Tuesday, 19 July 2011

Displaying pharmacophores from Pharmer in Avogadro

Avogadro has a plugin architecture that allows you to drop a Python script into a particular folder to add additional functionality, whether it be a new menu item, a new display method or whatever. I've previously used this to write an extension to read comp chem log files using cclib. This time I need to add a new display method (or Engine in the lingo of Avogadro) that will depict a pharmacophore.

So what's Pharmer? Well, until the release of Pharao by Silicos last year there were no open source pharmacophore programs. And the recent release of Pharmer by David Koes bumps the number up to two. Pharmer focuses on pharmacophore search - ultra-fast pharmacophore search, that is. It does this by precomputing an index that allows very efficient searching. The common denominator of Pharmer and Pharao is not only "Phar", but also that both use the Open Babel library.

The file format used by Pharmer is simply JSON, which is easily edited by a text editor. Here's an example that was created using the ZINC Pharmer interface: HSP90.txt. If you install Avogadro 1.0.1 with Python support on Windows, also have Python 2.6 installed in C:\Python26, and copy the Python script shown below to C:\Program Files (x86)\Avogadro\bin\engineScripts, then you can add the Pharmacophore engine (click "Add" in the "Display Types" panel; note: you can add more than one Pharmacophore engine if you want to display more than one pharmacophore at the same time). Once added, click on Settings and Browse to open the Pharmer JSON file. If nothing appears on the screen, try rotating the display slightly.

Note: The image above was created by joining the output of the following Pharmer command using "obabel --join" and depicting with Avogadro:
pharmer dbsearch -dbdir db_712_actives -in HSP90.txt -out results.sdf -reduceconfs 1 -sort-rmsd

pharmacophore.py:
import os
from PyQt4.Qt import *
import Avogadro as avo
from numpy import array

# Get JSON from my own Python installation
import sys
sys.path.append("C:\\Python26\\Lib\\site-packages")
sys.path.append("C:\\Python26\\lib")
import json

colorlookup = {
  'Hydrophobic': [0, 139, 69],
  'HydrogenAcceptor': [255, 165, 0],
  'HydrogenDonor': [211, 211, 211],
  'Aromatic': [205, 0, 205],
  'PositiveIon': [0, 0, 238],
  'NegativeIon': [255, 0, 0],
  }

class Engine(QObject):
  # declare the changed() signal
  __pyqtSignals__ = ("changed()",)

  # constructor
  def __init__(self):
    QObject.__init__(self)
    self.widget = None
    self.textbox = None
    self.filename = ""
    self.pharma = []

  def name(self):
    return "Pharmacophore"

  def flags(self):
    return avo.EngineFlags.NoFlags

  def debug(self, text):
    return
    filename = os.path.join("C:\\", "Users", "Noel", "Desktop", "tmp.txt")
    output = open(filename, "a")
    print >> output, text
    output.close()

  @pyqtSignature("")
  def browse(self):
    self.filename = str(QFileDialog.getOpenFileName())
    if not self.filename:
      return
    
    self.textbox.setText(self.filename)
    with open(self.filename) as f:
      query = json.load(f)
      self.pharma = [x for x in query['points'] if x['enabled']]
    if len(self.pharma) > 0:
      for p in self.pharma:
        x += p['x']
        y += p['y']
        z += p['z']
      x /= len(self.pharma)
      y /= len(self.pharma)
      z /= len(self.pharma)
      for p in self.pharma:
        p['x'] -= x
        p['y'] -= y
        p['z'] -= z
    self.debug("Pharma: %s" % self.pharma)
    self.emit(SIGNAL("changed()"))

  @pyqtSignature("")
  def clear(self):
    self.filename = ""
    self.textbox.setText(self.filename)
    self.pharma = []
    self.emit(SIGNAL("changed()"))
    
  def settingsWidget(self):
    self.widget = QWidget()

    layout = QVBoxLayout(self.widget)

    self.textbox = QLineEdit(self.filename)
    self.textbox.setReadOnly(True)
    layout.addWidget(self.textbox)
    
    buttons = QHBoxLayout(self.widget)
    layout.addLayout(buttons)

    self.browsebtn = QPushButton("Browse")
    self.clearbtn = QPushButton("Clear")
    buttons.addWidget(self.browsebtn)
    buttons.addWidget(self.clearbtn)
    
    QObject.connect(self.browsebtn, SIGNAL("clicked()"), self, SLOT("browse()"))
    QObject.connect(self.clearbtn, SIGNAL("clicked()"), self, SLOT("clear()"))

    return self.widget

  def renderOpaque(self, pd):
    self.debug("Len of pharma: %d" % len(self.pharma))
    if len(self.pharma) == 0:
      return
    
    # Painter 
    painter = pd.painter
    # Molecule
    molecule = pd.molecule

    # Color
    color = pd.colorMap

    for point in self.pharma:
      if point['name'] in colorlookup:
        colvals = [float(x) / 255. for x in colorlookup[point['name']]] + [1.0]
        color.setFromRgba(*colvals)
      else:
        color.setFromRgba(0.3, 0.6, 1.0, 1.0)
      painter.setColor(color)        
      
      r = point['radius']
      self.debug("Radius: %.1f" % r)
      x, y, z = point['x'], point['y'], point['z']
      painter.drawSphere(array([x, y, z]), r)