Wednesday 21 May 2008

Cheminformatics toolkit face-off - SMARTS matching

SMARTS strings are really useful for substructure searching in molecules. They are sort of like regular expressions for molecules. The idea and syntax of SMARTS comes from the people at Daylight.

Rajarshi Guha, together with Dazhi Jiao (Uni. Indiana), have put together a test suite for SMARTS matchers, and run the test suite against the CDK, OpenBabel and OEChem. Greg contributed results for RDKit. The overall performance is described on Rajarshi's website.

Here's the current summary of the results for the 158 test cases, but check Rajarshi's page for a more up-to-date picture:
ToolkitTrueFalse
CDK1499
OpenBabel1499
RDKit1517
OpenEye1508


Image: Everybody stand back by Chris Radcliff (CC BY-SA 2.0)

Tuesday 20 May 2008

Cheminformatics toolkit face-off - Depiction Part 2

[See update (28/10/08).]

One of the aims of the previous toolkit face-off was to get some feedback on the best options for drawing images with different toolkits. I also hoped that a comparison of the images would allow bugs to be easily identified. And finally, I thought that a bit of competition might help improve depiction and structure diagram generators across the board.

Since the last post:
  • Molinspiration have approached me to be included in the face-off
  • I've learnt that I should remove hydrogens from CDK and OASA depictions and control the size of the generated image
  • Beda has done amazing work enhancing depiction in OASA, and has in fact now released OASA separately from BKChem as an independent cheminformatics toolkit
  • Greg is just about to release a new version of the RDKit which has improved depiction, and he has fixed the bug identified by PMR
  • And I've fixed some bugs myself in cinfony
Now the images themselves (same dataset as before): [depiction] and [structure diagram generation].

Notes:
  1. The face-off involves the open source toolkits the CDK, OASA and the RDKit, and the proprietary toolkits Cactvs and molinspiration.
  2. If you want to help improve these depictions or coordinate generators, why not leave a comment below suggesting specific ways to improve them, or highlighting specific things they could do better.
  3. Double bond stereochemistry doesn't seem to be preserved by the CDK, but this is possibly my fault (I'm awaiting a reply to an email to the cdk-users mailing list)
  4. Several people complained to me last time that I didn't give OASA a fair chance. In order to make it up, this time round I've made OASA the star attraction. The coordinates generated by the three open source toolkits are all depicted by OASA

Monday 12 May 2008

RSS feeds for chemistry projects on SourceForge

Wouldn't it be nice to know whether any of your favourite chemistry projects has released a new version? Or to keep abreast of the latest registrations of chemistry projects on SourceForge? No? I guess it's just me then.

Anyway, here are some RSS feeds I've thrown together to allow me to do just that:
  • latest chemistry releases
  • registrations of chemistry projects: latest and two months old

Note: the two-months-old RSS feed is better if you want to find some actual code or a working website when you click through.

Want to do the same for another software category? Here's the code (requires BeautifulSoup and PyRSS2Gen):

import datetime
import urllib

from BeautifulSoup import BeautifulSoup
import PyRSS2Gen

def download():
urls = ["http://sourceforge.net/search/index.php?words=trove%3A%28384%29"
"&sort=latest_file_date&sortdir=desc&offset=0&limit=100&"
"type_of_search=soft&pmode=0",
"http://sourceforge.net/search/index.php?words=trove%3A%28384%29"
"&sort=registration_date&sortdir=desc&offset=0&limit=100&"
"type_of_search=soft&pmode=0"]
urllib.urlretrieve(urls[0], "releases.html")
urllib.urlretrieve(urls[1], "registrations.html")

def converttodate(text):
if text=="(none)":
return None
t = map(int, text.split("-"))

return datetime.datetime(*t)

def makerss(filename, items, sortby, title):
rss = PyRSS2Gen.RSS2(
title = title,
link = "http://baoilleach.blogspot.com/2008/05/rss-feeds-for-chemistry-projects-on.html",
description = "baoilleach's RSS feed of "
"Chemistry projects on SourceForge",

lastBuildDate = datetime.datetime.now(),

items = [
PyRSS2Gen.RSSItem(
title = item["title"],
link = item["link"],
description = item["description"],
guid = PyRSS2Gen.Guid("%s %s" % (item["title"], item['lastrelease'])),
pubDate = item[sortby])
for item in items]
)

rss.write_xml(open(filename, "w"))

def analyse(project):
ans = {}
ans['title'] = project.a.string
ans['link'] = "http://sf.net" + project.a['href']

data = project.parent.parent
ans['lastrelease'] = converttodate(data('td')[5].string.strip())

ans['registered'] = converttodate(data('td')[4].string.strip())

data = project.parent.parent.findNextSibling()
ans['description'] = data.td.contents[0].strip()
if not ans['description']:
ans['description'] = data.td.contents[2].strip()

return ans

def processfile(filename):
html = open(filename, "r").read()
soup = BeautifulSoup(html)
projects = soup.findAll(lambda tag: tag.name=="h3" and tag.a
and tag.a['href'].startswith("/projects/"))

data = [analyse(project) for project in projects]
return data

if __name__=="__main__":
download()

data = processfile("registrations.html")
sometimeago = datetime.datetime.now() - datetime.timedelta(days=60)
olddata = [d for d in data if d['registered'] <= sometimeago]
makerss("oldregistrations.rss", olddata, "registered", "Registrations 60 days ago on SF")
makerss("newregistrations.rss", data, "registered", "Latest registrations on SF")

data = processfile("releases.html")
makerss("latestreleases.rss", data, "lastrelease", "Latest releases on SF")

Thursday 8 May 2008

Review of "Gnuplot in Action"

"Famous scientific plotting package". This succinct yet accurate description of gnuplot appears on the gnuplot SF project page. Despite being one of the most well-known open source scientific projects around, it has taken 15 years for the first book on gnuplot to be published. "Gnuplot in Action" by Phillip K. Janert will be published by Manning Publications later this year (one chapter available free) and aims to give an overview of how to use gnuplot, describing everything from how to read in data, style graphs, save images to more advanced topics such as macros, using gnuplot for CGI or calling it from scripting languages.

In the past I have used gnuplot to get a quick look at data in text files, and also to look at surfaces. I am used to looking up the gnuplot help system to figure things out, but although it's exhaustive, it's also a bit exhausting especially when you are simply trying to figure out whether something is possible or not. The fact that the gnuplot site has a long list of frequently-asked questions is also a sign of poor documentation. So there's definitely room for a book of this type.

Although I was afraid this book would simply be a long list of commands and switches (of which gnuplot has many, to be sure), "Gnuplot in Action" takes a much more interesting approach, illustrating everything with examples and focusing on the most useful options while simply referring the reader to the gnuplot help for more obscure options. The author isn't afraid of sympathising with the user, e.g. "Nevertheless, it is very different from the behavior we have come to expect from user interfaces in most programs" (in reference to how images are saved in gnuplot). Although the author has been using gnuplot for 15 years, he obviously is still aware of what the most annoying features are, and in this case, describes a handy macro to look after the horrible mess of writing an image to disk and resetting the terminal afterwards.

Somewhat bizarrely, the blurb for the book is pitched at business users (analysts and "Six Sigma Black Belts") and doesn't refer to scientists at all. But don't worry, the examples in the book contain everything from share price analysis to looking at phase transitions (reflecting the author's background in theoretical physics as well as in business), and in any case, the nature of the examples doesn't affect the tone of the book in any way.

So, overall I liked this book. I particularly liked the sidebars and comments on particular techniques. For example, the section on 3d plots includes a short discussion of the pitfalls of using 3d plots and alternative plotting methods that might be more suitable. The section on color, includes a similar warning as well a discussion on palette design (which references Why Should Engineers and Scientists Be Worried About Color?). This turns the book from being a straightforward technical manual to something more of a discussion of techniques. There are actually a couple of chapters still to come (13, 14, 15) which appear to be focused on where/how to use particular graphical analysis techniques.

Any negatives? Well, I wasn't very interested in the section on reading data from disk and transforming it - I think that anyone who knows Perl/Python is going to reshape/filter their data before getting it into gnuplot, but admittedly the book claims to be suitable for non-programmers. Also, the author's favorite interactive terminal, wxt, is not available for Windows and so I was a bit disappointed when I fired up gnuplot and couldn't find it. Regarding the connection between gnuplot and Python, the author doesn't mention the widely-used Gnuplot.py (although I'm not a big fan of this).

But overall, these are minor quibbles. I recommend this book to anyone who wants to make the most of gnuplot, that "famous scientific plotting package".

Cheminformatics toolkit face-off - Depiction

[See update (28/10/08).]

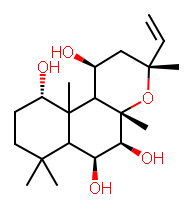
Now for some pretty pictures as well as some not so pretty. Yes, it's the turn of the structure diagram generators (SDGs) to strut their stuff and throw some shapes. How do they perform for 100 random compounds from PubChem?

Here are my results for depiction and structure diagram generation (Note: I will move these links to my regular hosting in the near future). The images were generated using cinfony, the code is here and the dataset is here.

Some comments:
(0) Rich Apodaca has written an overview of Open Source SDGs.
(1) 2D coordinate generation is independent of depiction. A SDG typically has both parts but coordinates could be generated with one toolkit and depicted with another.
(2) Looking good is not the same as chemical accuracy. But looking good is important too! :-)
(3) OASA (Obviously Another Stupid Acronym) is a Python SDG which is part of BKchem by Beda Kosata. To depict images, it uses Pycairo. OASA currently does not support stereochemistry (e.g. across double bonds) and so the generated coordinates will not be chemically-accurate in some circumstances. This of course does not affect its ability to depict coordinates generated by other toolkits. OASA can depict wedges and bonds but I haven't yet implemented this in cinfony.
(4) It is not possible to use the CDK's depiction mechanism natively from CPython using JPype (it's fine from Jython though). That is why I use OASA to depict the CDK's generated coordinates. Technically, this is because JPype doesn't allow subclassing of Java classes (JPanel in this case). It does however, allow Python classes to implement a Java interface. It would be great if the CDK could add a convenience interface to allow this (I can supply more details off-blog).
(5) The PubChem images and coordinates are generated by the Cactvs toolkit.
(6) There are two sets of RDKit images. Since the current release has quite poor depictions, I decided to also include the results from a development branch, which uses Aggdraw.
(7) It is important to consider how to handle hydrogens. With OASA, I just drew all the hydrogens. This is probably not a good idea.
(8) It is likely that I have not used the best parameters, etc. for generating some of these images. I welcome any suggestions to improve image quality.
(9) OASA wasn't able to layout CID 1373132, and so that molecule was not included (I guess I should have just caught the exception and continued). The error message was:
Traceback (most recent call last):
File "cdkjpype.py", line 464, in draw
oasa.cairo_out.cairo_out().mol_to_cairo(mol, filename)
File "bkchem\oasa\oasa\cairo_out.py", line 85, i
n mol_to_cairo
self._draw_edge( e)
File "bkchem\oasa\oasa\cairo_out.py", line 121,
in _draw_edge
side += reduce( operator.add, [geometry.on_which_
side_is_point( 
start+end, (
self.transformer.transform_xy( a.x,a.y))) for a
in ring if a!=v1 and a!=v2])
File "bkchem\oasa\oasa\geometry.py", line 92, in
on_which_side_is_point
b = atan2( y2-y1, x2-x1)
ValueError: math domain error

(10) PubChem entries with more than 1 connected component were not included in this test. (As a result, the number of molecules shown is actually less than 100.)

Image: Creation by Ariana Rose Taylor-Stanley (CC BY 2.0)

Wednesday 7 May 2008

ANN: cinfony 0.1 - the toolkit of cheminformatics toolkits

What?
cinfony presents a common Python API to three open source cheminformatics toolkits: OpenBabel, RDKit and the CDK. cinfony makes it easy to carry common cheminformatics tasks, but allows you to access the underlying toolkit objects at any point.

Why?
(1) In the past, cheminformaticians have chosen a particular toolkit and have only used that toolkit. This is because of the impedance mismatch between APIs of different toolkits, and indeed, the language differences between different toolkits (CDK is Java, OpenBabel and RDKit are C++, for example). cinfony makes it easy to start using a new toolkit because the API for reading/writing files, calculating fingerprints, creating 2D depictions, etc. is the same no matter whether you are using OpenBabel, RDKit or the CDK.

(2) Different toolkits have different capabilities. cinfony allows you to access all of these capabilities in the same Python script. For example, you can read a molecule using OpenBabel, draw it using RDKit and calculate descriptors using the CDK.

Where?
cinfony 0.1 is now available for download from googlecode.

Who?
Early adopters. This is pretty much a test release.

Why are there so many dependencies?
Oops, look at the time. Gotta go. Have fun installing.

Image: DryIcons (modified)

Thursday 1 May 2008

Shortened SMILES for URLS - Why a big SMILES need not mean a long face

Rajarshi has put together a RESTful web service that returns a 2D depiction of a molecule (using the CDK) given a SMILES string. However, it turns out that the SMILES has a maximum size of 255 characters (appears to be an OS or mod_python limit). That should be enough, sez you, but for a random sample of 100 PubChem molecules, 9 are greater than the limit (these include explicit hydrogens, I should point out).

Between Rajarshi and myself, we worked out a solution: zip the SMILES and then base64 it (so that it can be used in a URL). Here are the lengths of the original SMILES strings, the bzipped2 strings, and finally the base64ed strings:
280 101 136
316 113 152
432 110 148
282 106 144
320 92 124
372 115 156
452 143 192
326 96 128
268 94 128
In each case, the final string is less than half the size of the original string. The actual strings themselves all begin with the same few letters (don't ask me why) which means that the same RESTful URL can be used to handle both the SMILES strings and their compressed cousins. For example, sildenafil can be viewed at both this url (containing the SMILES) and this url (containing the encoded form).

Notes: (1) Python methods bz2.compress() and base64.urlsafe_b64encode() are used. (2) Bzip2 was used instead of gzip or zip simply because it has an easier to use API. (3) A SMILES string needs to have a certain length before the procedure will actually result in any compression. In the sildenafil example, the encoded string is in fact longer than the original (108 vs. 61)