Tuesday 26 February 2008

Molecular Modelling: Tools, GUIs and Visualisation

I've just been invited to speak at "Molecular Modelling: Tools, GUIs and Visualisation" (March 11-13, Runcorn, UK), a meeting organised by the CCP1 group of UK computational chemists. Come along if you can, as the meeting sounds very interesting. As you can see below, there are speakers from a number of chemistry projects, both open and closed: OpenBabel, Avogadro, Molekel, Molpro, cclib, GaussSum, the CCP1GUI, GAMESS, and GAMESS-UK.

Here's the announcement:

Meeting: Molecular Modelling: Tools, GUIs and Visualisation

11th - 13th March 2008

This is to announce a CCP1 meeting looking at graphical interfaces, visualisation and tools for molecular modelling in general, but with the focus towards electronic structure.

There are a large number of graphical interfaces and associated tools for working with electronic structure and molecular mechanics/dynamics codes in use in the computational chemistry community today. Many of these tools do similar jobs, but all have their own specialities, strengths and weaknesses.

The aim of this meeting is to bring together the developers and users of these tools to:

- raise awareness of the existing software tools and capabilities.
- allow users to give the developers feedback on what is needed and which areas are not being sufficiently covered.
- explore novel ways of visualising molecular data and other tasks.
- provide an opportunity to discuss collaborations.

We already have speakers confirmed from projects including OpenBabel, Avogadro, Molekel, Molpro, cclib, GaussSum, The CCP1GUI, GAMESS, and GAMESS-UK.

The meeting will be held at the Holiday Inn in Runcorn, Cheshire, from 11th-13th March (starting after lunch on the 11th and running through to lunch on the 13th). The afternoon of the 13th will be reserved for developers to run tutorials/practicals at Daresbury Laboratory.

We still have some slots available for speakers, so if you are a code developer or user, and would be interested in speaking, then please contact: j.m.h.thomas@dl.ac.uk

For registration information, please visit the meeting webpage at:

http://www.ccp1.ac.uk/chemtoolsmeet

We look forward to seeing you in March!

========================================
Jens Thomas,
STFC Daresbury Lab,
Warrington,
WA4 4AD, UK.
http://www.cse.scitech.ac.uk
========================================
Sunday 24 February 2008

How to eyeball your clusters

A common task when dealing with multidimensional data is to cluster the data somehow. People have been known to spend a lot of time worrying about the clustering method, when really it's the distance measure (or implicit distance measure) that's more important. Garbage in, garbage out. So long as you don't use single or complete linkage without a good reason, you'll be fine.

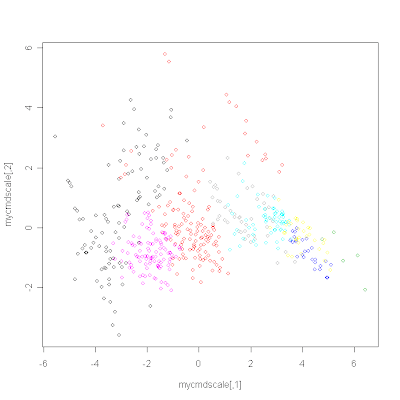
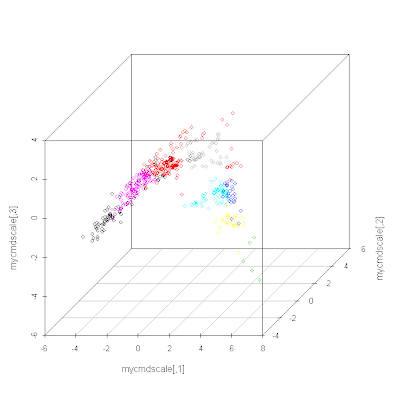
I'm a great believer in looking at the data. That is, checking it out visually. This is mainly as a sanity check. How real are these clusters? Did I forget to scale the data so that everything is clustered on the basis of the variable with the biggest range?

The following R code clusters using the non-hierarchical method k-means clustering (so no nice dendrogram). Once all the points have been assigned to a particular cluster you can look at the data in 2D or 3D (using principal coordinate analysis, aka classical multidimensional scaling) and colour the points by cluster:

data <- read.table("Boston.txt")
data <- scale(data)

myclust <- kmeans(data, 10)
print(myclust)
summary(myclust)
myclust$size
myclust$cluster

# Represent the data in 2D and colour by cluster
distances <- dist(data, method="euclidean")
mycmdscale <- cmdscale(distances, 2)
plot(mycmdscale, cex=0)
points(mycmdscale, col=myclust$cluster)

# Let's try 3D (you need to install scatterplot3d first)
library(scatterplot3d)
mycmdscale <- cmdscale(distances, 3)
s3d <- scatterplot3d(mycmdscale, color=myclust$cluster)

# Let's try interactive 3D
library(rgl) # Need to install this package first
plot3d(mycmdscale, col=myclust$cluster, size=5)
Thanks to Rajarshi for pointing out how to generate the interactive 3D plot.

Saturday 23 February 2008

Calculate circular fingerprints with Pybel

I've just realised that a friend of mine, Florian Nigsch, has started blogging about cheminformatics. In one of his posts, he describes the calculation of circular fingerprints with Python.

In his program, he parses the structure of a MOL2 file himself to work out the connectivity and so on. I wondered whether it would be easier with Pybel. I was hoping that the breadth-first iterator that comes with OpenBabel could be used to simplify things, but in the end I needed to do the breadth-first search myself (here I use a queue).
import os
import sys
from collections import deque # Better than list.pop(0)

import pybel
import openbabel as ob

# Set up a translator to Sybyl atom types
ttab = ob.OBTypeTable()
ttab.SetFromType("INT")
ttab.SetToType("SYB")

def bfs(mol, startatom):
visited = [False] * (mol.OBMol.NumAtoms() + 1)
ans = []
queue = deque([(startatom, 0)])
while queue:
atom, depth = queue.popleft()
idx = atom.GetIdx()
visited[idx] = True
atomtype = ttab.Translate(atom.GetType())
ans.append("%s%s" % (["", "%d-" % depth] [depth>0],
atomtype))
if depth < D:
for atom in ob.OBAtomAtomIter(atom):
if not visited[atom.GetIdx()]:
queue.append((atom, depth+1))
return ";".join(ans)

if __name__ == "__main__":
D = 2 # default max depth
if len(sys.argv)>1:
inputfile = sys.argv[1]
if len(sys.argv)>2:
D = int(sys.argv[2])
else:
sys.exit("Usage: BFS.py inputfile [depth=2]")

for mol in pybel.readfile(inputfile.split(".")[-1],
inputfile):
fp = []
for atom in ob.OBMolAtomIter(mol.OBMol):
fp.append(bfs(mol, atom))
print "\t".join([mol.title] + fp)
The advantage of using a library like Pybel is that this program will work for any of several file formats including SMILES. Also, it's trivial to use other atom types apart from Sybyl atom types if desired. Note that the output is not exactly identical to that of Florian's program. In particular, I don't fold together multiple environments that occur at the same depth.

Update (25/02/08): Improved the code after review by Andrew Dalke (see below for original and comments).

Wednesday 20 February 2008

Update: Check citations for ACS journals

Just a quick word to say that I've updated my citation checker to handle ACS formats that don't include titles, e.g. JACS, Inorg. Chem. and so on...but maybe wait a while before testing - CrossRef seems to be down at the moment.

Friday 15 February 2008

Check citations for ACS journals using PubMed and CrossRef

I recently described a citation format checker for ACS journals. Now I present a web page that allows you to check your actual references, not just the format. This is powered by PubMed (using BioPython) and CrossRef (explained here), currently the only two publicly available sources of journal metadata for Biology and Chemistry journals.

Simply copy your footnotes from your Word document, paste into the form in the ACS citation checker, and click "Check". This will check just the first reference; repeated clicks on "Check" will check each reference one after the other.

Although CrossRef recently (see comments here and here) improved the quality of the metadata it supplies over its public API, where the metadata is also available in PubMed, PubMed typically wins out (e.g. CrossRef is missing the title for several of the papers in my test case).

I have set up this service for ACS publications. If you're interested in setting this up for other journals, perhaps we could collaborate on sharing code, etc. Of course, if you're a publisher and wish to improve the quality of the references submitted, feel free to make me an offer I can't refuse. :-)

Wednesday 13 February 2008

Which are worse? PubMed metadata or CrossRef metadata?

Tough call, eh? :-)

Given a DOI, CrossRef's OpenURL won't give you any author except the first author, and won't give you the end page of an article. In other words, it won't give you enough information to create a citation for a paper.

And PubMed? PubMed will give you all the authors, though it truncates them all to two initials. If you want the full journal name, you will have to capitalise it yourself, which isn't trivial to do automatically (e.g. "Journal of the american chemical society"); if you want the journal abbreviation, you will have to insert the periods yourself, which again isn't quite trivial (it's not just a question of sticking a period in front of everything in sight).

My favourite thing of all about PubMed is that even where a paper is in PubMed and where the paper has a DOI, the DOI mightn't be in PubMed (e.g. doi://10.1016/j.jmb.2003.08.006 and PMID 14499606). Nice. This last one means that to get PubMed metadata relating to that DOI, you need to first look up CrossRef, and then use that metadata (i.e. journal, year, volume and startpage) to look up PubMed.

So, which do I think is worse? CrossRef - but only because it doesn't give enough information to create a citation.

Friday 8 February 2008

Searching PubMed with Python

[Update 30Nov09] The Bio.EUtils module has been replaced by Bio.Entrez. This means that the following code and links will no longer work. However, see the comments at the end of the email where readers have posted updated code.

Given a DOI or PMID, how can you find metadata for a publication using Python? The EUtils module of BioPython, by Andrew Dalke, is your friend.

For a DOI, you need to do a search:
from Bio import EUtils
from Bio.EUtils import DBIdsClient

doi = "10.1016/j.jmb.2007.02.065"

client = DBIdsClient.DBIdsClient()
result = client.search(doi + "[aid]", retmax = 1)
summary = result[0].summary()

For a PMID, there's a more direct method:
from Bio import EUtils
from Bio.EUtils import DBIdsClient

PMID = "17238260"
result = DBIdsClient.from_dbids(EUtils.DBIds("pubmed", PMID))
summary = result[0].summary()

So, what can you do with the summary? Something like the following maybe:
>>> data = summary.dataitems
>>> print data.keys()
['DOI', 'Title', 'Source', 'Volume', ...., ]
>>> print "%s. %s %s %s, %s, %s." % (
... ", ".join(data['AuthorList'].allvalues()),
... data['Title'], data['Source'], data['PubDate'].year,
... data['Volume'], data['Pages'])
...
O'Boyle NM, Holliday GL, Almonacid DE, Mitchell JB. Using
reaction mechanism to measure enzyme similarity. J Mol Biol
2007, 368, 1484-99.

For more info: