Specifically, I want to depict the ligand in the protein active site, with the protein represented by an isosurface coloured by depth in the protein (values which I will supply), and with protein-ligand hydrogen bonds shown. I have a protein .MOL2 file with hydrogens added; I have a ligand .MOL file, I have the corresponding protein .PDB file (no hydrogens and the ligand and waters have been removed); and I have a text file containing, for each atom in the protein .MOL2 file, a value related to the depth of that atom in the protein. And here is the final image (screenshotted from the browser , cropped a little, and saved as a JPG with zero compression - click for the original image):
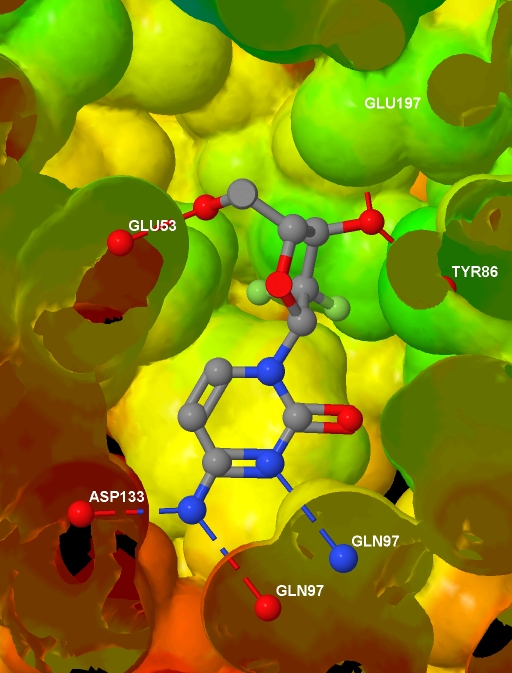 Before presenting the necessary code, to help understanding I note that Jmol imposes some constraints:
- bonds can only exist between molecules in the same model
- if the slab is turned on, it cuts through every model
- Jmol can identify the residue names in the PDB file, but not in the .MOL2 file
- Jmol does not automatically identify protein-ligand hydrogen bonds
- if mapping property data onto an isosurface, it needs to be supplied for every atom in the model (actually, there is an alternative, but this is a good rule of thumb)
<html>
<head>
  <script type="text/javascript"
  src="file:///D:/Tools/Jmol/jmol-11.3.53/Jmol.js">
  </script>
  </head>
<body>
<script type="text/javascript">
  var protein = "1p62";
  jmolInitialize("file:///D:/Tools/Jmol/jmol-11.3.53", true);
  var jmolcmds = [
  // Load the molecules
  "load file:///D:/Ligands/" + protein + "_ligand.mol",
  "set appendNew = false",
  "load APPEND file:///D:/Proteins/" + protein + "_protein.mol2",
  "set appendNew = true",
  "load APPEND file:///D:/Proteins/" + protein + ".pdb",

  // Turn up display quality but don't yet show anything
  "display none; set antialiasDisplay true",

  // The following is the output of "show orientation"
  "reset;center {67.99645 35.5767 19.92025}",
  "rotate z -21.47; rotate y 25.81; rotate z 74.65",
  "zoom 400.0; set rotationRadius 35.03",

  // Add the HBonds
  "model 1.1",
  "connect 3.1 (molecule=1 and elemno=8) \
(molecule!=1 and elemno=7) HBOND RADIUS 0.07 CREATE",
  "connect 3.2 (molecule=1 and elemno=7) \
          (molecule!=1 and elemno=8) HBOND RADIUS 0.07 CREATE",
  "connect 3.1 (molecule=1 and elemno=8) \
(molecule!=1 and elemno=8) HBOND RADIUS 0.07 CREATE",
  "connect 3.1 (molecule=1 and elemno=7) \
(molecule!=1 and elemno=7) HBOND RADIUS 0.07 CREATE",

  // Load info for isosurface and draw it
  "{model=1.1}.property_d = load(\"D:/Data/" + protein +"_rd.txt\")",
  "isosurface select(molecule!=1 and within(10.0, molecule=1)) \
ignore(molecule=1) resolution 5 sasurface 0 \
COLOR ABSOLUTE 30 120 REVERSECOLOR MAP property_d",

  // Select and label the HBonded protein atoms in model 2.1
  "define hbondedproteinatoms within(3.2, true, \
model=1.1 and molecule=1 and (elemno=7 or elemno=8)) \
and not within(0.1, true, model=1.1 and molecule=1) \
and model=2.1 and not elemno=1 and not solvent",
  "select hbondedproteinatoms; font label 15 SANSERIF BOLD",
  "set labelFront; color label white; label %n%R",

  // Add to selection the ligand and
  // its HBonded protein atoms in model 1.1
  "select selected or (((molecule=1 and model=1.1) or \
within(3.2, molecule=1 and model=1.1 and \
(elemno=7 or elemno=8))) and not elemno=1)",

  // Slice through everything with a slab
  "slab on; slab 51",

  // Remove the Jmol logo (I will reference Jmol instead)
  "set frank off",

  // Show the selected data from all models
  "model 0; display selected",
  ];
  jmolApplet(700, jmolcmds.join("; "));
</script>
</body>
</html>


