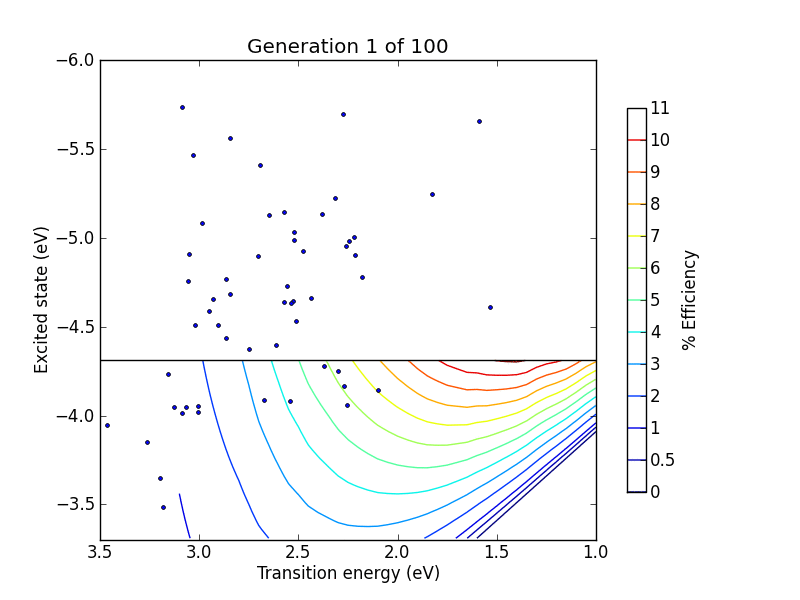
Here's an animated GIF I created to show the progress of a Genetic Algorithm towards creating a molecule with a specific electronic structure (for more details on the background, see these posts [1] and [2]):
vals = range(0, 10) + range(19, 100 ,10)
for N in vals:
     homo, trans = self.xy[N]
     lumo = [x+y for x,y in zip(homo,trans)]
     pylab.title("Generation %d of 100" % (N+1,))
     pylab.plot(trans, lumo, ".")
     pylab.savefig("pictures/animation%02d.png" % N)
     pylab.clf()
You can then use ImageMagick to do the PNG to animated GIF conversion. ImageMagick is a bit like Open Babel - it is a one-stop shop for file format conversion, plus it can do a whole set of transformations, and furthermore can be accessed as a programming library. It is available cross-platform (I used it on Windows). The main binary is called "convert", and the conversion is done as follows:convert.exe -delay 20 -loop 0 animation*.png GA_animation.gifYou can also specify different timings for every frame as I did above. I wrote a little script to help with this:
1 comment:
Very nice! Interesting in animation package for R it will be the sasme easy to create gif...
Post a Comment