Friday, 28 March 2008

Pybel as a generic API for cheminformatics libraries - proof of concept using CDK

I'm very interested in interoperability of open source chemistry codes. Following a comment by Egon on a recent post of mine, I started wondering whether the Pybel API could used with other cheminformatics libraries as a backend.

The advantage of this for the user would be (a) to reduce the learning curve - if you know how to use Pybel, you can access any of several different cheminformatics libraries with the same syntax, (b) the same scripts could be used to carry out a particular analysis using different cheminformatics libraries - different libraries may have different fingerprints, descriptors or implementations of particular algorithms (this is of course also useful for cross-checking the results of different programs) and (c) help reduce the divide between different cheminformatics toolkits (interoperability!!).

The rationale behind Pybel (described in the paper) lends itself to this use. Pybel doesn't attempt to wrap all the functionality of OpenBabel, but only the most common tasks in cheminformatics. For advanced options, or additional functionality, you can go behind the scenes and access OpenBabel directly. As a result, I propose that the Pybel API represents a generic API (one of many possible, of course) for accessing any cheminformatics library.

To test this, I have created CDKabel, a proof of concept which shows that the Chemistry Development Kit (CDK) can be accessed using Pybel syntax through Jython. CDKabel does not yet pass all of the Pybel tests, but there's enough to show that the approach has some merit. Compare the following: here's some Python code using Pybel and OpenBabel:
C:\Documents and Settings\oboyle>python25
Python 2.5 (r25:51908, Sep 19 2006, 09:52:17) [MSC v.1310 32
bit (Intel)] on win32
Type "help", "copyright", "credits" or "license" for more inf
ormation.
>>> from pybel import *
>>> for mol in readfile("sdf", "head.sdf"):
... print "Molecule has molwt of %.2f and %d atoms" %
(mol.molwt, len(mol.atoms))
...
Molecule has molwt of 122.12 and 15 atoms
Molecule has molwt of 332.49 and 28 atoms
>>>
Now here's some Jython code with CDKabel and CDK:
D:\Tools\CDK>set CLASSPATH=cdk-1.0.2.jar

D:\Tools\CDK>..\jython2.2.1\jython
Jython 2.2.1 on java1.6.0_05
Type "copyright", "credits" or "license" for more informa
tion.
>>> from cdkabel import *
>>> for mol in readfile("sdf", "head.sdf"):
... print "Molecule has molwt of %.2f and %d atoms" %
(mol.molwt, len(mol.atoms))
...
Molecule has molwt of 122.04 and 15 atoms
Molecule has molwt of 331.96 and 28 atoms
>>>
Well, at least they agree on the number of atoms :-) (It's my fault - CDK has like, ten different ways of calculating the molecular mass, and I just chose randomly :-) )

I've only spent a few minutes throwing CDKabel together, so it doesn't do much beyond the example shown. However, if interested, you can download it and try it for yourself.

I'd appreciate comments on the idea that there is a core Python API that could be usefully applied to several cheminformatics libraries. Would anyone use CDKabel if it were available?

Wednesday, 26 March 2008

MadMol - Chemistry-aware code

There are definitely better things you can do with the functional group fingerprint (FP4) of OpenBabel, but instead, I've created MadMol. Basically, give MadMol a SMILES string such as CC(=O)CCl and it will tell you all you ever wanted to know about that molecule:
That there's a Primary_carbon. Isn't that a Alkylchloride? Wake up and smell the Ketone, cause that's what it is. Most people wouldn't realise this is a C_ONS_bond. It's a 1,3-Tautomerizable (or your money back). I don't believe it, it's a Rotatable_bond! Wake up and smell the CH-acidic, cause that's what it is.

And here's the code (requires Pybel, and the file SMARTS_InteLigand.txt):

import sys
import random

import pybel

def readsmartsfile(filename="SMARTS_InteLigand.txt"):
patterns = []
inputfile = open(filename, "r")
for line in inputfile:
line = line.strip()
if line and line[0]!="#":
colon = line.find(":")
name = line[:colon]
smarts = line[colon+1:].strip()
patterns.append([pybel.Smarts(smarts), name])
return patterns

phrases = ["I don't believe it, it's a %s!",
"Isn't that a %s?",
"It's a whadyamacallit, a %s.",
"Looks like a %s to me.",
"That there's a %s.",
"Most people wouldn't realise this is a %s.",
"It's a %s (or your money back).",
"Wow, a %s. Last time I saw one of these, I hit the"
"fire alarm and ran.",
"Could be a %s...yes, I'm sure of it.",
"It's a %s if I've ever seen one.",
"Wake up and smell the %s, cause that's what it is.",
"It's a %s. I wish I had one.",
"You've hit the jackpot, you and your %s!",
"A %s. You know, back in the day, we used to have"
"fun with these.",
"It takes me back years, this %s does."]

if __name__=="__main__":
if not len(sys.argv)==2:
sys.exit("You need a SMILES string like CC(=O)CCl")
molecule = pybel.readstring("smi", sys.argv[1])
print "So you want me to tell you about %s, do you?\n" % (
sys.argv[1],)
patterns = readsmartsfile()
print " ".join([random.choice(phrases) % name for
smarts, name in patterns if smarts.findall(molecule)])

Friday, 21 March 2008

Python - the scripting language of chemistry

Python is a cross-platform scripting language which is easy to learn, and encourages readability and elegant code. If you're a chemist, it's also the most widely-used scripting language out there:Leave a comment below if you feel I've missed something. Here are some dated but related links: ChemPython.org, the text of Andrew Dalke's talk from PyCon 2004, and Python for Chemistry in 21 Minutes.

Monday, 17 March 2008

Cube file considered harmful

Several quantum chemistry packages can be encouraged to output the electron density or the magnitude of the wavefunction for a particular orbital at grid points in a volume. This sort of volumetric data is commonly known as a cube file, as this is the name that Gaussian uses, although the volume may not necessarily be a cube. Such a cube file can be used to plot molecular orbitals at various isosurface values.

And that basically, is all they're good for. Nice pictures.

So, what's wrong with that? Well, try doing some sort of analysis with them. Let's say you're into conceptual DFT and want to start partitionally the electron density in weird and wonderful ways. You'll soon find that the cube file is unusable.

For example, during my PhD I wrote a Python script to automate the calculation of Hirshfeld atomic charges using cube files. To do this you need the electron density of the molecule itself, as well as that for each atom on its own. In my thesis, I have a test case using HCN. This required a cube of volume 10x10x12Ang3 with a grid spacing of 0.075Ang. That's pretty fine spacing, but it's required for accurate evaluation of the volume integration. And that's a pretty big cube, but it turns out that electron density falls off pretty slowly with distance.

I gave up trying calculate Hirshfeld charges for the molecules in which I was actually interested, ruthenium polypyridyl complexes. I worked out that a cube file of the appropriate size would be 13GB in size. And like I said, you don't just need one.

But what if I had access to the basis set itself and the molecular orbital coefficients? Then I could have bypassed the cube file and accessed the underlying mathematical functions. At a recent meeting on Tools, Visualisation and GUIs organised by CCP1, the GAMESS-UK developers have agreed to work with cclib to make this happen. This would allow users/developers to write software to analyse the electron density independent of any particular QM package. If you're interested, get in touch.

To finish, here are some pretty pictures relating to Hirshfeld charge analysis. First here's HCN:The next image shows (a) the promolecule (sum of the electron densities of each of the atoms on its own), (b) the electron density, and (c) the difference between a & b, referred to as the deformation density, which shows how electron density has changed on formation of the molecule.And finally, for the carbon atom, (a) the free atom density, (b) the bonded atom density, and (c) the atomic deformation density.

Monday, 10 March 2008

Pybel publication in Chemistry Central Journal

Our Pybel paper has just been published in the new Open Access journal, Chemistry Central Journal:
Pybel: a Python wrapper for the OpenBabel cheminformatics toolkit Noel M O'Boyle, Chris Morley and Geoffrey R Hutchison. Chemistry Central Journal 2008, 2:5. [DOI]

Here's the abstract:
Background

Scripting languages such as Python are ideally suited to common programming tasks in cheminformatics such as data analysis and parsing information from files. However, for reasons of efficiency, cheminformatics toolkits such as the OpenBabel toolkit are often implemented in compiled languages such as C++. We describe Pybel, a Python module that provides access to the OpenBabel toolkit.

Results

Pybel wraps the direct toolkit bindings to simplify common tasks such as reading and writing molecular files and calculating fingerprints. Extensive use is made of Python iterators to simplify loops such as that over all the molecules in a file. A Pybel Molecule can be easily interconverted to an OpenBabel OBMol to access those methods or attributes not wrapped by Pybel.

Conclusion

Pybel allows cheminformaticians to rapidly develop Python scripts that manipulate chemical information. It is open source, available cross-platform, and offers the power of the OpenBabel toolkit to Python programmers.

The paper describes the rationale behind Pybel, its implementation and some examples of its use. If you are looking for help on how to install or use Pybel, see the Python page on the OpenBabel website, or the examples page.

And if you don't like Python (!), you can also access OpenBabel from Perl, Ruby, Java and C++. So check it out.

Tuesday, 26 February 2008

Molecular Modelling: Tools, GUIs and Visualisation

I've just been invited to speak at "Molecular Modelling: Tools, GUIs and Visualisation" (March 11-13, Runcorn, UK), a meeting organised by the CCP1 group of UK computational chemists. Come along if you can, as the meeting sounds very interesting. As you can see below, there are speakers from a number of chemistry projects, both open and closed: OpenBabel, Avogadro, Molekel, Molpro, cclib, GaussSum, the CCP1GUI, GAMESS, and GAMESS-UK.

Here's the announcement:

Meeting: Molecular Modelling: Tools, GUIs and Visualisation

11th - 13th March 2008

This is to announce a CCP1 meeting looking at graphical interfaces, visualisation and tools for molecular modelling in general, but with the focus towards electronic structure.

There are a large number of graphical interfaces and associated tools for working with electronic structure and molecular mechanics/dynamics codes in use in the computational chemistry community today. Many of these tools do similar jobs, but all have their own specialities, strengths and weaknesses.

The aim of this meeting is to bring together the developers and users of these tools to:

- raise awareness of the existing software tools and capabilities.
- allow users to give the developers feedback on what is needed and which areas are not being sufficiently covered.
- explore novel ways of visualising molecular data and other tasks.
- provide an opportunity to discuss collaborations.

We already have speakers confirmed from projects including OpenBabel, Avogadro, Molekel, Molpro, cclib, GaussSum, The CCP1GUI, GAMESS, and GAMESS-UK.

The meeting will be held at the Holiday Inn in Runcorn, Cheshire, from 11th-13th March (starting after lunch on the 11th and running through to lunch on the 13th). The afternoon of the 13th will be reserved for developers to run tutorials/practicals at Daresbury Laboratory.

We still have some slots available for speakers, so if you are a code developer or user, and would be interested in speaking, then please contact: j.m.h.thomas@dl.ac.uk

For registration information, please visit the meeting webpage at:

http://www.ccp1.ac.uk/chemtoolsmeet

We look forward to seeing you in March!

========================================
Jens Thomas,
STFC Daresbury Lab,
Warrington,
WA4 4AD, UK.
http://www.cse.scitech.ac.uk
========================================

Sunday, 24 February 2008

How to eyeball your clusters

A common task when dealing with multidimensional data is to cluster the data somehow. People have been known to spend a lot of time worrying about the clustering method, when really it's the distance measure (or implicit distance measure) that's more important. Garbage in, garbage out. So long as you don't use single or complete linkage without a good reason, you'll be fine.

I'm a great believer in looking at the data. That is, checking it out visually. This is mainly as a sanity check. How real are these clusters? Did I forget to scale the data so that everything is clustered on the basis of the variable with the biggest range?

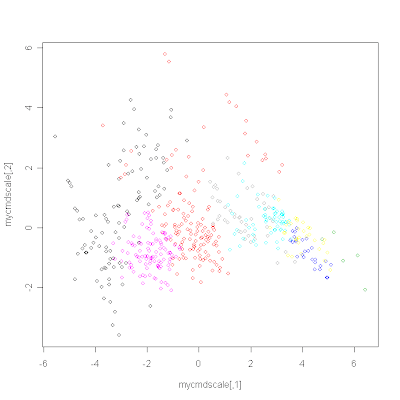
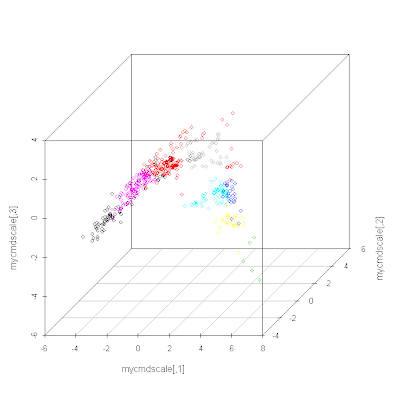
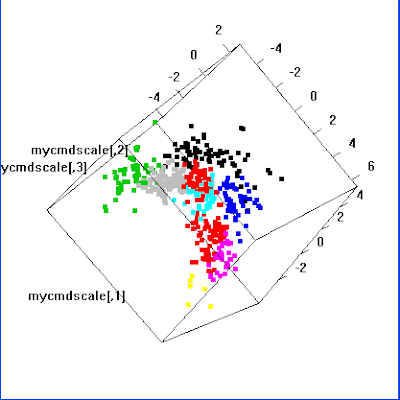
The following R code clusters using the non-hierarchical method k-means clustering (so no nice dendrogram). Once all the points have been assigned to a particular cluster you can look at the data in 2D or 3D (using principal coordinate analysis, aka classical multidimensional scaling) and colour the points by cluster:

data <- read.table("Boston.txt")
data <- scale(data)

myclust <- kmeans(data, 10)
print(myclust)
summary(myclust)
myclust$size
myclust$cluster

# Represent the data in 2D and colour by cluster
distances <- dist(data, method="euclidean")
mycmdscale <- cmdscale(distances, 2)
plot(mycmdscale, cex=0)
points(mycmdscale, col=myclust$cluster)

# Let's try 3D (you need to install scatterplot3d first)
library(scatterplot3d)
mycmdscale <- cmdscale(distances, 3)
s3d <- scatterplot3d(mycmdscale, color=myclust$cluster)

# Let's try interactive 3D
library(rgl) # Need to install this package first
plot3d(mycmdscale, col=myclust$cluster, size=5)
Thanks to Rajarshi for pointing out how to generate the interactive 3D plot.