Wednesday, 22 July 2009

Services built around open source software

Computer-aided chemistry is used today by all the major high-technology companies that are active in chemistry. Just like the meteorologist uses computers to forecast the weather, computers can be used to simulate and predict properties of molecules. This approach is documented to give companies and scientists a high return on investment. But few companies have the resources and skills to make it a reality. The cost of hardware, software, and specialized scientists makes this approach unattainable to most. hBar Lab addresses this problem by putting the required technology online. With hBar Lab there is:
  • No need for expensive hardware
  • No upfront payment for software
  • User-friendly interface makes it accessible for everyone, no specialized scientist necessary.
Source: hBar Lab - Computer-aided Chemistry On Demand

Support and consulting have always been ways of deriving income from open source software, but the web introduces new possibilities centered around web services. I have recently become aware of hBar Lab, whose web application is built entirely on open source software (MPQC, OpenBabel, Jmol) and who perform on-demand calculation of molecular properties:
The user login, select the property, e.g. ionization energy or geometry, and the molecule of interest, and then submit the query. The required calculations are seamlessly executed on computers in the background and once the calculations are done, the results will be returned in the user's inbox. It is as simple as that.
An interesting idea.

TwirlyMol - Status update re world domination

TwirlyMol was the world's first Javascript molecular viewer with shadows. It has been described as "and of course the shadows are cool" by Felix of Chemical Quantum Images.

Although TwirlyMol was only released into the wild to fend for itself in January, it has swiftly outpaced Chime and is rapidly approaching Jmol-like levels of deployment.

Well, almost. At least one other person is using it anyway. As part of a chemistry education project at the University of Wisconsin, TwirlyMol is being used on the ChemPrime wiki and on a student education portal, both of which look like two interesting resources under development. However, you should be warned - the TwirlyMol shadows have been removed!

TwirlyMol is freely available under a do-what-you-want-with-it license. You can even (*sob*) remove the shadows.

Wednesday, 15 July 2009

ANN: Symposium on Visual Analysis of Chemical Data (ACS Spring 2010)

Update 06/Sept/09: See second call for papers.

First Call for Papers:
Visual Analysis of Chemical Data
239th ACS National Meeting
San Francisco, March 21-25, 2010
CINF Division


Dear Colleagues,

We wish to announce an upcoming symposium focusing on innovative methods for visual representation and analysis of chemical data. Just as Edward Tufte has championed maximizing clarity and information content in statistical graphics, there is a need for methods to display chemical information that will maximize understanding, and allow rapid analysis and decision making.

We invite you to submit contributions that address various aspects of visualization of chemical data (such as structures, SAR data, literature, patents) including, but not limited to, the following topics:
  • With an ever increasing pool of descriptors, along with new and more sophisticated machine learning methods, QSAR models are becoming more difficult to interpret. How can information on model reliability, the presence of activity cliffs, and the range of applicability of a model and other relevant model properties be easily depicted?
  • Recently, virtual worlds 3D such as Second Life have presented new opportunities and challenges for the representation of chemical data. What is the potential of such a medium in education and communicating with the chemistry community?
  • Social software allows for rapid and convenient sharing of chemical data. Examples include Google Spreadsheets, ManyEyes, DabbleDB, and wikis, including Wikipedia. What are the implications for chemical research and education?
  • The visualization of the contents of large chemical datasets presents particular problems. How can an overview of the dataset be visualized so that it presents both the nature of the contents as well as the degree of diversity and similarity within the dataset? How can different datasets be visually compared?
  • Depicting 3D chemical information in 2D involves a loss of information. However, innovative 2D visualization methods can restore the most relevant information.
  • Chemical information comprises a diverse array of data types including chemical structures and diagrams (2D and 3D), associated assay results, conformations, QSAR models and their predictions. The visualization and integration of all these data into a single interface that aids interpretation and analysis is a continuing challenge.

We would also like to point out that sponsorship opportunities are available.

The on-line abstract submission system (PACS) will be open for submissions from 24th August. A second announcement will be made at that time.

Please contact Andrew, Jean-Claude or myself if you have any questions.

Yours sincerely,
Noel O'Boyle

On behalf of the symposium organizers:

Dr. Jean-Claude Bradley,
Drexel University, PA
bradlejc@drexel.edu

Dr. Andrew Lang,
Oral Roberts University, OK
alang@oru.edu

Dr. Noel O’Boyle,
Cambridge Crystallographic Data Centre, U.K.
oboyle@ccdc.cam.ac.uk

Image credit: prehensile

Tuesday, 7 July 2009

Sledgehammer, meet nut - Using Eclipse for Python

I usually use gvim or IDLE to edit Python files, but today I thought I'd try something a bit more heavyweight: Eclipse. Eclipse is widely used in the Java world. It's open source and freely available, and most importantly there is a Python plugin for Eclipse called PyDev.

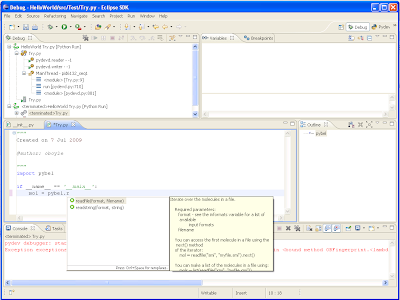
So what does Eclipse have that IDLE doesn't? Well, integration with the Python debugger for a start. Also, this sort of code completion is quite handy (click for a larger image):
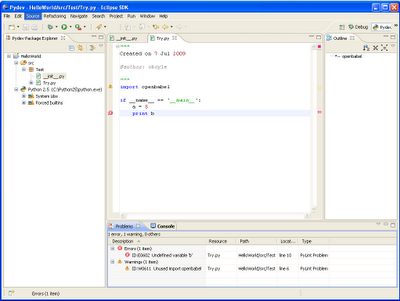
It also has nice integration with PyLint (see the bottom pane in the following figure) which catches various errors (e.g. mispelled variables) before you run a script:
Here are some notes:
  1. I followed these installation instructions and then sped through the manual.
  2. Pydev currently supports Eclipse 3.2 to 3.4. It took a while to find an Eclipse download page with version 3.4 but here it is. I installed Eclipse SDK 3.4.2.
  3. Start Eclipse, and click on Help/Software Updates. Add http://pydev.sourceforge.net/updates/ to the list of update sites. Tick the box and click Install to install PyDev.
  4. Following the details at http://www.fabioz.com/pydev/manual_101_interpreter.html, I added a Python interpreter (Name="Python 2.5", Executable="C:\Python25\python.exe").
  5. Installing pylint on Windows is a pain, so I used easy install:
    C:\Python25\Scripts\easy_install.exe pylint
    In the PyLint configuration, you need to specify the location of lint.py. Mine was at C:\Python25\Lib\site-packages\pylint-0.18.0-py2.5.egg\pylint\lint.py.