Don't you love checking that every reference has its full-stops, commas and semicolons in the right place? I wrote a Javascript format checker some time ago for JCIM format references, but it turns out that this format is shared by several if not all of the ACS journals. Recently, I was reminded just how useful it is when submitting to an ACS journal and it found I had left out an author's initials.
All you need to do is cut and paste the references from the end of your paper into the textbox in the format checker. Then click Check. (Note: make sure you don't have any blank lines) It will find common errors in formatting such as leaving out an author's initials or the final full-stop on a line. Note that it does not check whether the references themselves are correct, although that would be possible with current APIs.
When your eyes are hurting from looking at one too many "et al."s, try the format checker - it's a cite for sore eyes.
Tuesday, 29 January 2008
Friday, 11 January 2008
DOI or DOH? Proposal for a RESTful unique identifier for papers
Update (18/Jan/07): This proposal has been implemented by Andrew Perry
When DOIs first became widespread for papers, I was a big fan. Just by adding "http://dx.doi.org/" to the start of the DOI I could ensure that a link would always lead the reader to the correct web page of the publisher. As a unique identifier, the DOI could be used to connect disparate resources relating to papers; e.g. comments on papers in blog posts and Table of Contents pages of journals.
But...do we really need DOIs? At least in their current form? Let's consider the following paper (discussed in a previous blog post):
EL Willighagen, NM O'Boyle, H Gopalakrishnan, D Jiao, R Guha, C Steinbeck and D J Wild Userscripts for the Life Sciences BMC Bioinformatics 2007, 8, 487.
What unique identifiers could we use? Well, there's the DOI:
So, is it too late for OpenRef? Certainly not. Any publisher could implement it on their own server with an hour or two's work. Similarly, CrossRef could do it (though it would only work for those papers which have DOIs). Other Web 2.0 sites that manipulate information on publications could use it also; e.g. CiteULike and Connotea.
This would mean that you could instantly access information on a particular paper using a web browser and going to
Notes:
(1) For journals that don't use volumes, the openref would be of the form openref://Journal Name/Year/Page
(2) There are certain parallels for chemists between DOIs vs. openref and CAS numbers vs. InChI.
(3) The term RESTful is used in the sense of "RESTful web services" (an excellent book).
When DOIs first became widespread for papers, I was a big fan. Just by adding "http://dx.doi.org/" to the start of the DOI I could ensure that a link would always lead the reader to the correct web page of the publisher. As a unique identifier, the DOI could be used to connect disparate resources relating to papers; e.g. comments on papers in blog posts and Table of Contents pages of journals.
But...do we really need DOIs? At least in their current form? Let's consider the following paper (discussed in a previous blog post):
EL Willighagen, NM O'Boyle, H Gopalakrishnan, D Jiao, R Guha, C Steinbeck and D J Wild Userscripts for the Life Sciences BMC Bioinformatics 2007, 8, 487.
What unique identifiers could we use? Well, there's the DOI:
doi://10.1186/1471-2105-8-487Then there's the PubMed ID:
PMID 18154664Instead of these, I propose OpenRef:
openref://BMC Bioinformatics/2007/8/487Spot the difference. Neither the DOI nor the PMID can be derived from the paper itself. Similarly, it's not possible to figure out from the DOI or the PMID what the paper is (without access to the web, at least). Furthermore, the openref is available for all papers published, whether or not the publishers have assigned them a DOI (in associated with CrossRef). Needless to say, not all papers are in PubMed and so don't have PMIDs.
So, is it too late for OpenRef? Certainly not. Any publisher could implement it on their own server with an hour or two's work. Similarly, CrossRef could do it (though it would only work for those papers which have DOIs). Other Web 2.0 sites that manipulate information on publications could use it also; e.g. CiteULike and Connotea.
This would mean that you could instantly access information on a particular paper using a web browser and going to
http://dx.openref.org/BMC Bioinformatics/2007/8/487or
http://www.biomedcentral/openref/BMC Bioinformatics/2007/8/487instead of having to know the DOI or search on a publisher's web site.
Notes:
(1) For journals that don't use volumes, the openref would be of the form openref://Journal Name/Year/Page
(2) There are certain parallels for chemists between DOIs vs. openref and CAS numbers vs. InChI.
(3) The term RESTful is used in the sense of "RESTful web services" (an excellent book).
Thursday, 10 January 2008
Contrast this with colour blindness
This is a bit off-topic, but I was reading a description of some projects at the 2008 BT Young Scientist and Technology Exhibition [1], and came across this:
Apart from the fact that this is amazing work by a 13 and 14 year old, I didn't realise so many people are colour-blind, and it seems that it's sex-linked so that men have the worst of it (about 10% have some form, source: Wikipedia).
I can't find out any additional details on the web about the work by these guys, but I did find some good resources relating to web-accessibility and colour-blindness. The first is an existing Firefox extension called ColorBlindExt which runs the standard colour-blindness tests, and then adjusts web page colours depending on the results. The second is for those developing web pages, and lists tools to check colour constrast.
[1] This is the premier science fair for secondary school students in Ireland, and the winner is often a finalist in the equivalent European competition.
...Similar clever thinking was evident in the project prepared by Adam Keilthy (14) and Conor Scully (13) second years from Sutton Park School in Dublin. They developed a web browser that first scans and then changes screen colours to improve the view for those with red-green colour blindness.
"We built a web browser that would automatically adjust so you can see it better," explained Adam. Those with this common genetic disorder find it difficult or impossible to differentiate between green and red. Many web pages make ample use of these colours, making it difficult for the colour blind to read them. Adam wrote software that scans pixel by pixel, changing green to turquoise and red to purple.
"You can get yellow-blue colour blindness and total colour blindness, but these two conditions are very rare so we didn't programme for them," added Conor.
They also conducted a survey of classmates finding that 8 per cent of the boys had red-green colour blindness and one girl out of 90 female classmates.
Apart from the fact that this is amazing work by a 13 and 14 year old, I didn't realise so many people are colour-blind, and it seems that it's sex-linked so that men have the worst of it (about 10% have some form, source: Wikipedia).
I can't find out any additional details on the web about the work by these guys, but I did find some good resources relating to web-accessibility and colour-blindness. The first is an existing Firefox extension called ColorBlindExt which runs the standard colour-blindness tests, and then adjusts web page colours depending on the results. The second is for those developing web pages, and lists tools to check colour constrast.
[1] This is the premier science fair for secondary school students in Ireland, and the winner is often a finalist in the equivalent European competition.
Monday, 7 January 2008
Enhancing the web for scientists

Userscripts for the Life Sciences BMC Bioinformatics 2007,8, 487. (Open Access)
Userscripts are Javascript programs that are triggered to run in your web browser when you go to certain web pages. They can alter the content of the web page on-the-fly. For example, one of the userscripts described in the paper looks up all PDB IDs on a web page and adds a link to a webpage showing the structure. For userscripts to work, your browser (e.g. Firefox) needs a special extension (e.g. Greasemonkey).
Our userscripts are divided into two broad categories:
- Interacting with the scientific literature
- OSCAR3 running on HTML
- Add quotes from Chemical blogspace and Postgenomic to DOIs
- Add to Connotea
- Linking to chemical and biological data sources
- Enhancement of PubChem with 3D structures
- PDB-Jmol userscript
- Sechemtic
- Add quotes from Chemical blogspace to molecules
Image credit: Spiders web by Lida Rose (CC BY-ND 2.0)
Socialized science
I suggest we ditch the term "socialized science", and use "Pubmeds under the bed" instead. :-)
(For background, see PMR's post.)
(For background, see PMR's post.)
Wednesday, 19 December 2007
Matplotlib tips
Recently I've been doing some plots with matplotlib. Although it has all gone well, it hasn't been entirely obvious how to do certain things. So, for the benefit of posterity (i.e. me in a month's time) I'm going to record some of my newly-gained knowledge here.

- Colours: 'gray' is a colour too, 'k' is short for black.
- Don't like the border on a legend? You need to stick the legend into a variable, "leg = legend()" for example, and say "leg.draw_frame(False)" (this pearl of wisdom comes courtesy of the matplotlib source code).
- Want to make the legend text (and hence the legend) smaller? Try legend(prop={"size":10}).
- To adjust the position or font of text in a plot, it may be easiest to save as SVG, open in Inkscape (a truly fantastic program), click on the image and hit 'Ungroup' a few times (CTRL+SHIFT+G), make the adjustments, resave the SVG, and finally Export to Bitmap (300 dpi is probably good enough).
- Want two overlapping histograms on the same plot? Use the width keyword to hist() to set the bar widths to half the bin size. Also, catch the rectangles used to make the second histogram so that you can offset the bars by adding half the bin size:
Update 11/05/2010: With current version of Matplotlib, you need to replace width=width with rwidth=0.5.
a, b, c = hist(x, bins, facecolor='k', width=width)

for rect in c:
    rect.set_x(rect.get_x() + width)
You might also want to store the first rectangle of each histogram in a list and pass it as a first argument to legend. - To add a regression line between x=100 and x=600 (and get the R and significance values for free), try:
from scipy import stats
grad, inter, r, p, std_err = stats.linregress(x, y)
plot((100, 600), [grad*x + inter for x in [100, 600]]) - Line styles: "-" for solid, "--" for dashed, ":" for dotted. Unfortunately, the gaps in 'dashed' are too big. To define your own line style, you need to catch the line in a variable, e.g. "lines = plot(...)", and use lines[0].set_dashes((5,2)) for dashes of length 5 separated by gaps of 2 (unknown units).
- Want Greek symbols and subscripts in axes labels? It worked for me on windows with something like the following:
Note that the first time you run this on Windows, matplotlib might need to connect to the internet to download a needed component (MiKTeX). Also, when you make changes to the TeX stuff you might need to run your program twice to pick up on the changes.
rc('text', usetex=True)
xlabel(r"$\rho_{8.0}", fontsize="large")
Update 03/01/2011: With current version of Matplotlib, a TeX parser is included.
The Angstrom symbol can be include in a legend as follows: "RMSD ($\AA$)". For more information on available symbols, see the Matplotlib mathtext page.
Wednesday, 12 December 2007
Using Jmol for Drug Design - Depict Ligand in Active Site
In the previous article, I showed how to install Jmol. This article will look at depicting a ligand in a protein active site with a few extra complications. This example was not chosen to showcase Jmol - this is a real-life example of a figure I need to create. You can find on the web lots of examples of scripting Jmol to turn on/off ball-and-stick models. Figuring out how to do difficult things is a bit harder, and I hope others will find this example useful...
Specifically, I want to depict the ligand in the protein active site, with the protein represented by an isosurface coloured by depth in the protein (values which I will supply), and with protein-ligand hydrogen bonds shown. I have a protein .MOL2 file with hydrogens added; I have a ligand .MOL file, I have the corresponding protein .PDB file (no hydrogens and the ligand and waters have been removed); and I have a text file containing, for each atom in the protein .MOL2 file, a value related to the depth of that atom in the protein. And here is the final image (screenshotted from the browser , cropped a little, and saved as a JPG with zero compression - click for the original image):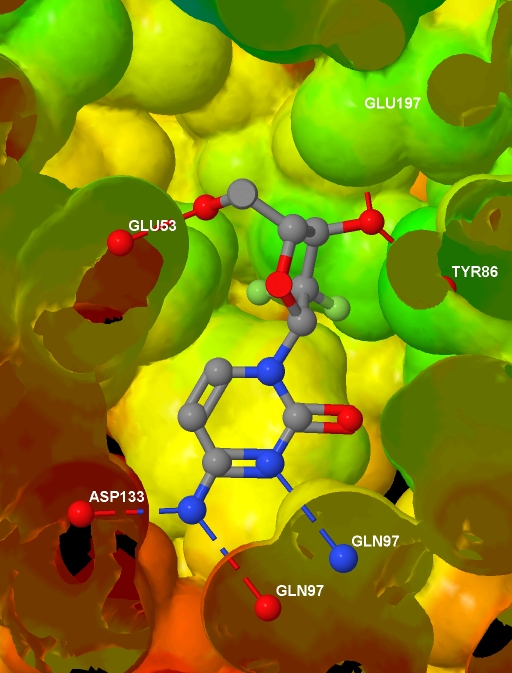 Before presenting the necessary code, to help understanding I note that Jmol imposes some constraints:
Specifically, I want to depict the ligand in the protein active site, with the protein represented by an isosurface coloured by depth in the protein (values which I will supply), and with protein-ligand hydrogen bonds shown. I have a protein .MOL2 file with hydrogens added; I have a ligand .MOL file, I have the corresponding protein .PDB file (no hydrogens and the ligand and waters have been removed); and I have a text file containing, for each atom in the protein .MOL2 file, a value related to the depth of that atom in the protein. And here is the final image (screenshotted from the browser , cropped a little, and saved as a JPG with zero compression - click for the original image):
Before presenting the necessary code, to help understanding I note that Jmol imposes some constraints:- bonds can only exist between molecules in the same model
- if the slab is turned on, it cuts through every model
- Jmol can identify the residue names in the PDB file, but not in the .MOL2 file
- Jmol does not automatically identify protein-ligand hydrogen bonds
- if mapping property data onto an isosurface, it needs to be supplied for every atom in the model (actually, there is an alternative, but this is a good rule of thumb)
<html>
<head>
  <script type="text/javascript"
  src="file:///D:/Tools/Jmol/jmol-11.3.53/Jmol.js">
  </script>
  </head>
<body>
<script type="text/javascript">
  var protein = "1p62";
  jmolInitialize("file:///D:/Tools/Jmol/jmol-11.3.53", true);
  var jmolcmds = [
  // Load the molecules
  "load file:///D:/Ligands/" + protein + "_ligand.mol",
  "set appendNew = false",
  "load APPEND file:///D:/Proteins/" + protein + "_protein.mol2",
  "set appendNew = true",
  "load APPEND file:///D:/Proteins/" + protein + ".pdb",

  // Turn up display quality but don't yet show anything
  "display none; set antialiasDisplay true",

  // The following is the output of "show orientation"
  "reset;center {67.99645 35.5767 19.92025}",
  "rotate z -21.47; rotate y 25.81; rotate z 74.65",
  "zoom 400.0; set rotationRadius 35.03",

  // Add the HBonds
  "model 1.1",
  "connect 3.1 (molecule=1 and elemno=8) \
(molecule!=1 and elemno=7) HBOND RADIUS 0.07 CREATE",
  "connect 3.2 (molecule=1 and elemno=7) \
          (molecule!=1 and elemno=8) HBOND RADIUS 0.07 CREATE",
  "connect 3.1 (molecule=1 and elemno=8) \
(molecule!=1 and elemno=8) HBOND RADIUS 0.07 CREATE",
  "connect 3.1 (molecule=1 and elemno=7) \
(molecule!=1 and elemno=7) HBOND RADIUS 0.07 CREATE",

  // Load info for isosurface and draw it
  "{model=1.1}.property_d = load(\"D:/Data/" + protein +"_rd.txt\")",
  "isosurface select(molecule!=1 and within(10.0, molecule=1)) \
ignore(molecule=1) resolution 5 sasurface 0 \
COLOR ABSOLUTE 30 120 REVERSECOLOR MAP property_d",

  // Select and label the HBonded protein atoms in model 2.1
  "define hbondedproteinatoms within(3.2, true, \
model=1.1 and molecule=1 and (elemno=7 or elemno=8)) \
and not within(0.1, true, model=1.1 and molecule=1) \
and model=2.1 and not elemno=1 and not solvent",
  "select hbondedproteinatoms; font label 15 SANSERIF BOLD",
  "set labelFront; color label white; label %n%R",

  // Add to selection the ligand and
  // its HBonded protein atoms in model 1.1
  "select selected or (((molecule=1 and model=1.1) or \
within(3.2, molecule=1 and model=1.1 and \
(elemno=7 or elemno=8))) and not elemno=1)",

  // Slice through everything with a slab
  "slab on; slab 51",

  // Remove the Jmol logo (I will reference Jmol instead)
  "set frank off",

  // Show the selected data from all models
  "model 0; display selected",
  ];
  jmolApplet(700, jmolcmds.join("; "));
</script>
</body>
</html>
Subscribe to:
Posts (Atom)