x1, y1, val1
x1, y2, val2
...
x1, yN, valN
[blank line]
x2, y1, val(N+1)
x2, y2, val(N+2)
...
x2, yN, val(2N)
[blank line]
...and so on...
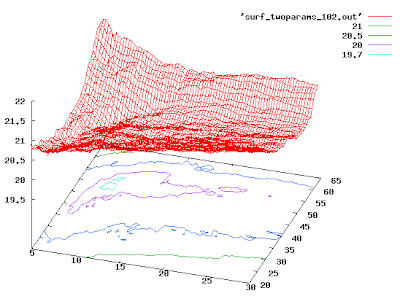
Once you've done this, here are the magic Gnuplot commands:
splot 'mygriddata.txt' with lines
set contour
set cntrparam levels discrete 19.7, 20, 20.5, 21, 22, 23, 24
replot
At this point, you should click on the graph and spin it around until it looks nice. Then you can save it to disk as a PNG (for better quality, use PS output):
set terminal png
set output 'plot.png'
replot

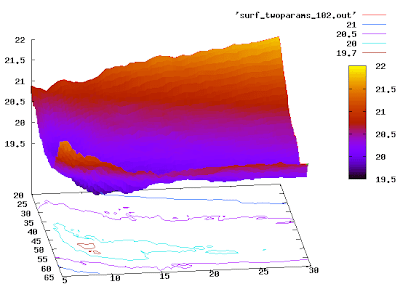
If you want it even nicer, you can try:
set pm3d
set hidden3d
replot

or
set pm3d at sb
replot

I saw your posting regarding Gnuplot, and thought you might be interested to know that there is now a book on it: "Gnuplot in Action". You can pre-order it directly from the publisher: Manning: Gnuplot in Action.
ReplyDeleteThe book includes chapters on multi-dimensional plotting and color management, including recommendations for optimal palette design for data visualization.
If you want to learn more about the book and the author, check out my book page at Principal Value - Gnuplot in Action.
Let me know if you are interested in a review copy.
I certainly am interested - I think that open source packages are woefully underrepresented in terms of shelf space, e.g. compare Photoshop and Gimp. So, well done!
ReplyDeleteHad to modify it a little bit to make it work:
ReplyDelete#!/usr/bin/gnuplot
# Plot my datafile
splot 'datapoints.val' with lines
# Creates grid
set dgrid3d
# Nicer looking
set pm3d
set hidden3d
# Plot
replot
pause -1
This comment has been removed by a blog administrator.
ReplyDelete