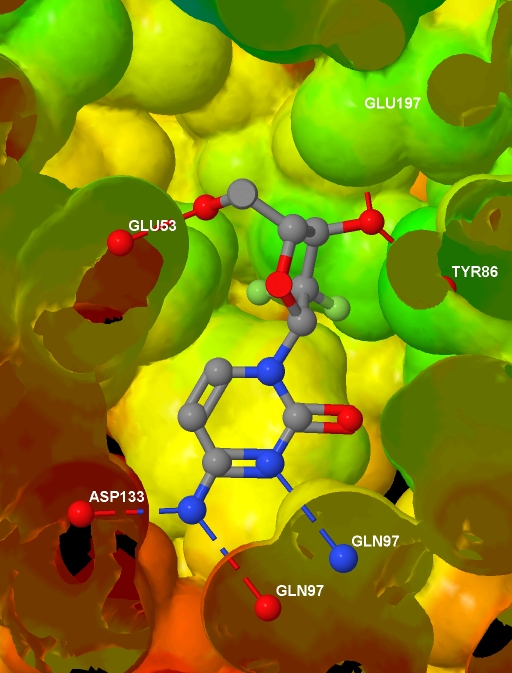
Specifically, I want to depict the ligand in the protein active site, with the protein represented by an isosurface coloured by depth in the protein (values which I will supply), and with protein-ligand hydrogen bonds shown. I have a protein .MOL2 file with hydrogens added; I have a ligand .MOL file, I have the corresponding protein .PDB file (no hydrogens and the ligand and waters have been removed); and I have a text file containing, for each atom in the protein .MOL2 file, a value related to the depth of that atom in the protein. And here is the final image (screenshotted from the browser , cropped a little, and saved as a JPG with zero compression - click for the original image):
 Before presenting the necessary code, to help understanding I note that Jmol imposes some constraints:
- bonds can only exist between molecules in the same model
- if the slab is turned on, it cuts through every model
- Jmol can identify the residue names in the PDB file, but not in the .MOL2 file
- Jmol does not automatically identify protein-ligand hydrogen bonds
- if mapping property data onto an isosurface, it needs to be supplied for every atom in the model (actually, there is an alternative, but this is a good rule of thumb)
<html>
<head>
  <script type="text/javascript"
  src="file:///D:/Tools/Jmol/jmol-11.3.53/Jmol.js">
  </script>
  </head>
<body>
<script type="text/javascript">
  var protein = "1p62";
  jmolInitialize("file:///D:/Tools/Jmol/jmol-11.3.53", true);
  var jmolcmds = [
  // Load the molecules
  "load file:///D:/Ligands/" + protein + "_ligand.mol",
  "set appendNew = false",
  "load APPEND file:///D:/Proteins/" + protein + "_protein.mol2",
  "set appendNew = true",
  "load APPEND file:///D:/Proteins/" + protein + ".pdb",

  // Turn up display quality but don't yet show anything
  "display none; set antialiasDisplay true",

  // The following is the output of "show orientation"
  "reset;center {67.99645 35.5767 19.92025}",
  "rotate z -21.47; rotate y 25.81; rotate z 74.65",
  "zoom 400.0; set rotationRadius 35.03",

  // Add the HBonds
  "model 1.1",
  "connect 3.1 (molecule=1 and elemno=8) \
(molecule!=1 and elemno=7) HBOND RADIUS 0.07 CREATE",
  "connect 3.2 (molecule=1 and elemno=7) \
          (molecule!=1 and elemno=8) HBOND RADIUS 0.07 CREATE",
  "connect 3.1 (molecule=1 and elemno=8) \
(molecule!=1 and elemno=8) HBOND RADIUS 0.07 CREATE",
  "connect 3.1 (molecule=1 and elemno=7) \
(molecule!=1 and elemno=7) HBOND RADIUS 0.07 CREATE",

  // Load info for isosurface and draw it
  "{model=1.1}.property_d = load(\"D:/Data/" + protein +"_rd.txt\")",
  "isosurface select(molecule!=1 and within(10.0, molecule=1)) \
ignore(molecule=1) resolution 5 sasurface 0 \
COLOR ABSOLUTE 30 120 REVERSECOLOR MAP property_d",

  // Select and label the HBonded protein atoms in model 2.1
  "define hbondedproteinatoms within(3.2, true, \
model=1.1 and molecule=1 and (elemno=7 or elemno=8)) \
and not within(0.1, true, model=1.1 and molecule=1) \
and model=2.1 and not elemno=1 and not solvent",
  "select hbondedproteinatoms; font label 15 SANSERIF BOLD",
  "set labelFront; color label white; label %n%R",

  // Add to selection the ligand and
  // its HBonded protein atoms in model 1.1
  "select selected or (((molecule=1 and model=1.1) or \
within(3.2, molecule=1 and model=1.1 and \
(elemno=7 or elemno=8))) and not elemno=1)",

  // Slice through everything with a slab
  "slab on; slab 51",

  // Remove the Jmol logo (I will reference Jmol instead)
  "set frank off",

  // Show the selected data from all models
  "model 0; display selected",
  ];
  jmolApplet(700, jmolcmds.join("; "));
</script>
</body>
</html>
9 comments:
That is pretty nifty... never used JMol much, maybe I should :)
Very nice demo! Two comments:
1. where are the ligands hydrogens?
2. where is the Jmol applet??
I know Jmol can be embedded in Wordpress [1], but have to admit that I have not tried in blogger.com myself.
1.http://www.openscience.org/blog/?p=208
@karol: It can also do isosurfaces of Gaussian .cube files.
@egon:
1. Hydrogens removed for clarity
2. One of the points of this series is to show that Jmol's functionality is not limited to spinning molecules around on a webpage. Hence, no applet. Ok, maybe that's not a great excuse, but it took me a while just to get this blog post together...
Felix (and others?) have embedded Jmol in blogger.
"One of the points of this series is to show that Jmol's functionality is not limited to spinning molecules around on a webpage. Hence, no applet."
Mmm... and you can't rotate or zoom in on an active site? That's what I am interested in. Hence, the applet. :)
@Egon: I've updated the post with links to a low quality and high quality applet. But if I find out that you've just been spinning that molecule...:-)
Brilliant! Very nice!
so how about ray-tracing in povray?
or are you planning to do that anyway?
Felix, please see:
http://chem-bla-ics.blogspot.com/2007/10/bob-improved-pov-ray-export-of-jmol.html
I've done the ray trace, but the image above is more informative (the lighting is too much in the ray trace; also a small bug with the text). The image is here.
Post a Comment